Senin, 24 Oktober 2011

Gaya_dan_Momen_Primer


Untuk input beban momen primer pada program analisa struktur, ujung kiri dan kanan balok adalah jepit (meskipun soalnya salah satu atau kedua2nya sendi, karena sendi didefinisikan pada data restraint) :


Catatan : perhatikan notasi, W=Q=total beban


https://sites.google.com/site/as4cyber/program_frame2d_matlab
https://sites.google.com/site/as4cyber/program_grid_matlab
https://sites.google.com/site/as4cyber/program_truss2d_matlab

Minggu, 23 Oktober 2011

Contoh Urutan Cara Mengerjakan

Contoh Menggambarkan Bidang M,D :

1. Soal : Balok menerus (gambar di bawah); E=2e6 ton/m2; Dimensi balok  40x70 cm (L=8m) dan 40x50 (L=6m dan L=7m) 

2. Pemodelan dan Persiapan Data :
Batang 1 :       A=0.4*0.7 = 0.28m2;    I=0.011433 m4
Batang 2,3,4 : A=0.4*0.5=0.20m2;      I=0.004167 m3;

Restraints :
Titik 1          : 1,1,1  (jepit)
Titik 2,3,4,5 : 1,1,0  (sendi)

Pembebanan :
Gaya & Momen Primer :
Batang 1 :

Batang 2 :

Batang 3 :
Batang 4 :


3.  INPUT DATA :


%****PORTAL 2D---TEKNIK SIPIL UNISSULA SEMARANG----

%****nama file : BALOKMENERUS----oleh :sumirin 1/11/2011----
%****struktur : blk menerus di atas 5 tumpuan, beban merata variasi
     clear all
     clc
%****General Data---
     type='p2d'
     nfile='BALOKMENERUS'
%****Property---i,E,A,I---
     prop = [   1   2.0e6  0.28  0.011433
                2   2.0e6  0.20  0.004167];
%****Coordinates---
%****--- Joint   X    Y  ---
     coord=[ 1   0    0
             2   8    0 
             3  14    0 
             4  20    0 
             5  27    0 ];
%****Element data---
%****--- Element  J1 J2  prop---
     element=[ 1   1   2    1
               2   2   3    2
               3   3   4    2
               4   4   5    2];       
%****Nodal Restraint---
%****---- Joint  JR1   JR2  JR3---
     Support=[ 1    1     1     1
               2    1     1     0
               3    1     1     0
               4    1     1     0
               5    1     1     0];
%****Joint Load---
%****---Joint   FX   FY   MZ---
     JL=[ 1   0   0   0 ];
%****Load Data---
     Ra1=7.5;     Rb1=7.5;
     Ma1=15;      Mb1=-15;
            Ra2=2.7;      Rb2=6.3;
            Ma2=3.6;      Mb2=-5.4;
     Ra3=6;       Rb3=6;
     Ma3=7.5;     Mb3=-7.5;
            Ra4=7;        Rb4=7;
            Ma4=8.167;    Mb4=-8.167;
%****
     AML=[ 1  0   Ra1  Ma1   0   Rb1  Mb1
           2  0   Ra2  Ma2   0   Rb2  Mb2  
           3  0   Ra3  Ma3   0   Rb3  Mb3
           4  0   Ra4  Ma4   0   Rb4  Mb4 ]; 
%****Call function for analysis portal 2d--------------------
[dof,index,coord,element]=FRAME2D_sdata(prop,element,coord,type);
[S,Sm,SmS,Cx,Cy,RT,L,A,Joint,Xj,Xk,Yj,Yk]=FRAME2D_stiff...
    (prop,element,coord,index,nfile);
[IR,IF,Support]=FRAME2D_ldata(Support,dof);
[DF,AR,AM]=FRAME2D_analysis_result...
    (element,dof,index,IF,IR,S,Sm,JL,AML,RT,Support,type,nfile);
[joint_disp,support_reaction,beam_endforces]=FRAME2D_print_result...
    (JL,AML,dof,Support,element,IF,IR,DF,AR,AM,type,nfile);
%****end data------------------------------------------------
%
      FRAME2D_xplot
%      


4.  Kontrol Kesetimbangan :


Support Reactions :
Joint          Rx             Ry             Mz 
    1    0.0000e+000    9.0284e+000    1.9076e+001
    2    0.0000e+000    9.3054e+000    0.0000e+000
    3    0.0000e+000    1.0695e+001    0.0000e+000
    4    0.0000e+000    1.5495e+001    0.0000e+000
    5    0.0000e+000    5.4756e+000    0.0000e+000


Jumlah Gaya Arah X : Px+Rx=0        0+0=0  ... ok!!!
Jumlah Gaya Arah Y : Py+Ry=0      
                                  Py= 15 + (3*6/2) + (4*6/2) + (7*2) = 50 ton
                                  Ry=9.0284 + 9.3054 + 10.695 + 15.495 + 5.4756 = 49.994 ~ 50 ...ok!


5. OUTPUT PROGRAM

STIFFNESS MATRIX METHOD : PROGRAM FRAME2D 
File Name : BALOKMENERUS_2.txt

Joint Loads :
Joint       Fx          Fy          Mz 
    1       0.000       0.000       0.000

Member Loads :
Member       Fx1          Fy1          Mz1          Fx2          Fy2          Mz2
    1        0.000        7.500       15.000        0.000        7.500      -15.000
    2        0.000        2.700        3.600        0.000        6.300       -5.400
    3        0.000        6.000        7.500        0.000        6.000       -7.500
    4        0.000        7.000        8.167        0.000        7.000       -8.167

Support Restraints :
Joint          Dx          Dy          Rz 
    1           1           1           1 
    2           1           1           0 
    3           1           1           0 
    4           1           1           0 
    5           1           1           0 

Joint Displacements :
Joint          Dx             Dy             Rz 
    1    0.0000e+000    0.0000e+000    0.0000e+000 
    2    0.0000e+000    0.0000e+000    7.1299e-004 
    3    0.0000e+000    0.0000e+000   -2.5665e-004 
    4    0.0000e+000    0.0000e+000   -4.4234e-004 
    5    0.0000e+000    0.0000e+000    1.9361e-003 

Support Reactions :
Joint          Rx             Ry             Mz 
    1    0.0000e+000    9.0284e+000    1.9076e+001
    2    0.0000e+000    9.3054e+000    0.0000e+000
    3    0.0000e+000    1.0695e+001    0.0000e+000
    4    0.0000e+000    1.5495e+001    0.0000e+000
    5    0.0000e+000    5.4756e+000    0.0000e+000

Member End Forces :
Member       Fx1          Fy1          Mz1          Fx2          Fy2          Mz2
    1        0.000        9.028       19.076        0.000        5.972       -6.848
    2        0.000        3.334        6.848        0.000        5.666       -4.845
    3        0.000        5.029        4.845        0.000        6.971      -10.671
    4        0.000        8.524       10.671        0.000        5.476       -0.000

<<< end of file >>> 


6.  FREE  BODY DIAGRAM  DAN GAMBAR BIDANG M-D

Batang 1 :

Batang 2 :


Contoh Soal Pelengkung

Nilai Mahasiswa - Analisa Struktur 4 - 2011/2011


 NILAI  MAHASISWA
  MATA KULIAH  : ANALISA STRUKTUR IV (2011/2012)

No NIM Nama
1 022032642 MUHAMAD NUR KHAKIM
2 022032664 USMAN TANJUNG
3 022072873 ACHMAD GUNAWAN
4 022072878 ANINDITA BASKORO ADIYAKSA
5 022072884 EKO ARI JATMIKO
6 022072885 HADI SETIONOTO
7 022072896 MIFTAHURRAHMAN TSANI
8 022072909 SELAMAT SAMSUL ARIPIN
9 022082924 AKHMAD RENDRA
10 022082926 AMIRIL MUSTAQIM
11 022092983 ABDILLAH AKHMAD
12 022092984 ABDU ROBBIH EL KAYYIS FIKRI
13 022092985 ADI WIBOWO
14 022092986 ADIGUSTIO AMINI
15 022092987 AGUNG SATRIO WIBOWO
16 022092988 AHSAN HABIB
17 022092989 AINUR ROFIQ
18 022092990 ALAMSYAH FATIH P
19 022092991 ALI GHUFRON
20 022092992 ANDI FIRMANSYAH

21 022092993 ANDRIAS BASKORO PUTRA
22 022092996 ARIS HARTANTO
23 022092997 AWANG YUDANTO
24 022092998 AWIFA RIZKA RUSDIANA
25 022092999 BAGUS ANGGARA W.
26 022093000 DEARY NURRACHMAN
27 022093001 DICKY PRATOMO HENDIANTO
28 022093002 DONY WARITA
29 022093003 EDI SANTOSA
30 022093005 ERIS YOGA PERMANA
31 022093006 FARID ROHMAN SYARIFUDIN
32 022093007 FARIZ LUQMAN MAULANA
33 022093008 HAZMI AMUDY
34 022093009 ISMAIL
35 022093010 JEHAN MUKTI HIDAYAT
36 022093011 KHOIRUL HADI
37 022093012 M. IHSAN HALIMI AL HARIS
38 022093013 MAWARTO IMAM SAFII
39 022093014 MISBAKHUL ANAM
40 022093015 MUHAMAD MUSTAMAR


41 022093016 MUHAMAD RUSLI AHYAR
42 022093017 MUHAMMAD AMRI WIDYANGGA
43 022093019 MUHAMMAD SHODIQ IHSAN
44 022093020 MUKHAMMAD YUSUF
45 022093021 NAWWAN AHMAD ZULFIAN
46 022093022 NOVI PERMATASARI
47 022093023 REZKI NURHIKMAH
48 022093024 RIO KURNIAWAN UNTORO
49 022093025 RIZKI ADIYASA
50 022093026 SAIK HIDAYATUL AHMADA
51 022093027 SANGGA PRAMANA
52 022093028 DENI TIAWARMAN
53 022093029 SIGIT AJI SUSILO
54 022093030 SINGGIH ADHITYA
55 022093031 SUSANA ROHMANITA

Load Distribution

Load Distribution

Gravity Load Distribution
Image of the ceiling of the Cathedral in Avila, SpainArchitects must consider not only what loading conditions might effect a structure, but also how those loads are transfered from their point of origin through the structure to the ground. Architectural design decisions concerning the structural framing system will dictate this flow of forces. The most direct path from the point of loading to the ground will create the most efficient structure. The continuity of this line of transfer is essential. However, this direct path is not always possible. As a matter of fact, due to the nature of live loads this path is constantly changing!

image of the ceiling of the cathedral in Avila, Spain with the load path from arches to column drawn as arrows
The arrows indicate the load path. >>>Under re-construction<<<

load path from beam to girder to column
The load at the midspan of the joist of the frame is illustrated as a large arrow pointing down. This load is split into two parts, with a proportional part going to each end of the beam. This in turn becomes a point load at the midspan of the smaller beams. They transfer the load to the earth. The load on each column in this case is only one quarter of the initial load. This is one method of distributing a load.

column tributary areas in a square bay
The second drawing illustrates a wooden floor of thick planks that span between two beams. Each of the four squares of the flat surfaces is the tributary area of the beam below it. A tributary area of a structural element (such as a joist, beam, column, or wall) is the area that contributes to the loading of that specific element. In this case, the plans transfer their loads and pass them on to the two beams. These beams can only transfer their loads equally to the two columns which support them. Thus, the tributary area can be drawn by determining the supporting characteristics of the horizontally spanning members.
This is again illustrated below for a simple frame structure. The loads are gathered by each structural element and passed on to that element's supporting elements. These supports in turn pass their loads to the next supporting element until the original load has been transferred all the way to the earth.

load path within a tributary area for a column
The load distribution pattern and the explicit summation of the loads can have a direct effect upon the size of the elements. Load distribution often causes unequal loading of the vertical supporting members. This may or may not be indicated by the designed form of that element.

typical bay configurations
Load Distribution
WIND LOAD DISTRIBUTION
The essence of wind load distribution through a building from one building component to another, and how the building resists this load can be investigated by assuming a uniformly distributed wind load acting on any one face of the building at any one time. Normally a wind load design requires a separate analysis of wind from two perpendicular directions, such as wind from the north or south and then from the east or west.
Consider a one story, flat roofed, rectangular, wood framed building without a parapet. The wall receiving the direct pressure from the wind distributes the top half of its horizontal wind load to the roof and the bottom half to the foundation; it acts as a vertical beam with the roof and foundation acting as simple horizontal supports. The part of the load going to the foundation is distributed from the foundation to the ground. The portion of the load going to the roof tends to cause the roof to move laterally; this lateral movement is resisted by the end walls. The movement of the end walls is prevented by their connection to the foundation.
Since winds of 80 to 110 mph will create pressure on the side walls of buildings in the range of 15 to 30 psf, design forces of the wind will be considered between 20 or 25 psf (static load) in this course.

Distribusi beban

Distribusi Beban gravitasi
Gambar langit-langit Katedral di Avila, Spanyol Arsitek harus mempertimbangkan tidak hanya memuat apa yang mungkin efek kondisi struktur, tetapi juga bagaimana mereka beban yang ditransfer dari titik asal mereka melalui struktur ke tanah. Keputusan desain arsitektur tentang sistem framing struktural akan mendikte ini aliran kekuatan. Jalan paling langsung dari titik pembebanan ke tanah akan menciptakan struktur yang paling efisien. Kontinuitas baris ini transfer adalah penting. Namun, jalan ini langsung tidak selalu mungkin. Sebagai soal fakta, karena sifat beban hidup jalan ini terus berubah!

gambar langit-langit katedral di Avila, Spanyol dengan jalur beban dari lengkungan ke kolom digambar sebagai panah
Tanda panah menunjukkan jalur beban. >>> Dalam pembangunan kembali <<<

beban jalan dari balok ke balok ke kolom
Beban pada tengah bentang balok dari frame digambarkan sebagai panah besar menunjuk ke bawah. Beban ini dibagi menjadi dua bagian, dengan bagian proporsional akan masing-masing ujung balok. Hal ini pada gilirannya menjadi beban titik di tengah bentang balok yang lebih kecil dari. Mereka mentransfer beban ke bumi. Beban pada setiap kolom dalam hal ini hanya seperempat dari beban awal. Ini adalah salah satu cara mendistribusikan beban.

daerah pembebanan kolom di sebuah teluk persegi
Gambar kedua mengilustrasikan lantai dari papan kayu tebal yang rentang antara dua balok. Masing-masing dari empat kotak dari permukaan datar adalah daerah pembebanan dari berkas di bawahnya. Sebuah daerah pembebanan dari sebuah elemen struktur (seperti balok anak, balok, kolom, atau dinding) adalah daerah yang memberikan kontribusi untuk pemuatan elemen tertentu. Dalam hal ini, rencana pengalihan beban mereka dan meneruskannya pada dua balok. Balok ini hanya dapat mentransfer beban mereka sama dengan dua kolom yang mendukung mereka. Jadi, daerah pembebanan dapat ditarik dengan menentukan karakteristik pendukung anggota horizontal mencakup.
Ini lagi diilustrasikan di bawah ini untuk struktur rangka sederhana. Beban dikumpulkan oleh setiap elemen struktural dan diteruskan ke elemen elemen pendukung. Dukungan ini pada gilirannya lulus beban mereka untuk mendukung elemen berikutnya sampai beban asli telah ditransfer semua jalan ke bumi.
beban jalan dalam daerah pembebanan untuk kolom
Distribusi beban pola dan penjumlahan eksplisit dari beban dapat memiliki efek langsung pada ukuran elemen. Distribusi beban sering menyebabkan pemuatan tidak merata anggota pendukung vertikal. Hal ini mungkin atau mungkin tidak ditunjukkan oleh bentuk elemen yang dirancang.
teluk khas konfigurasi


DISTRIBUSI BEBAN ANGIN
Inti dari distribusi beban angin melalui sebuah bangunan dari satu komponen bangunan yang lain, dan bagaimana bangunan menolak beban ini dapat diselidiki dengan asumsi beban angin merata bertindak pada setiap menghadapi salah satu bangunan pada satu waktu. Biasanya desain beban angin memerlukan analisis terpisah angin dari dua arah tegak lurus, seperti angin dari utara atau selatan dan kemudian dari timur atau barat.
Pertimbangkan cerita satu, beratap datar, persegi panjang, kayu bangunan tanpa dinding yang dibingkai. Dinding menerima tekanan langsung dari angin mendistribusikan bagian atas beban angin horisontal ke atap dan bagian bawah untuk yayasan, itu bertindak sebagai balok vertikal dengan atap dan pondasi bertindak sebagai mendukung horisontal sederhana. Bagian dari beban pergi ke yayasan dari yayasan didistribusikan ke tanah. Bagian dari beban atap akan cenderung menyebabkan atap bergerak lateral, ini gerakan lateral ditolak oleh dinding akhir. Gerakan dinding akhir dicegah oleh koneksi mereka ke yayasan.
Karena angin 80 sampai 110 mph akan menciptakan tekanan pada dinding samping bangunan di kisaran 15 sampai 30 psf, desain kekuatan angin akan dipertimbangkan antara 20 atau 25 psf (beban statis) dalam kursus ini.

 Sumber :
http://darkwing.uoregon.edu/~struct/courseware/461/461_lectures/461_lecture19/461_lecture19.html 

Diagram Bidang Gaya Lintang

Shear (V) and Shear Diagrams

Shear (V) is the tendency for one part of a beam to slide past another part. The magnitude of the shear at any section is equal to the algebraic sum of loads and reactions acting perpendicular to that section.


rock ledge breaking under shear forces


SIGN CONVENTION
If the tendency of the section to the left of the cut is to move upward, the shear is positive; if it has a tendency to move down, it is negative.


shear sign convention


For simplicity in obtaining the correct sign, one may say that it is equal to the algebraic sum of loads and reactions to the left of the cut. Note that the internal shear on the end of the FBD acts in the opposite direction of the algebraic sum of the loads and reactions in order to balance these forces (SV = 0).

A shear diagram is a graphic representation of the shear at every point along the length of a member.

To plot a shear diagram on a beam, the shear must be calculated at each point along the length of the beam. One way is to simply plot the shear as the algebraic sum of the loads and reactions acting perpendicular to the beam at the left side of each increment along the length of the beam. Positive values are shown above and negative values below a reference axis.

How to draw a SHEAR DIAGRAM
Start at the left end and plot the external shear values with regard to the following:
  • The shear diagram is the graphic representation of the shear force at successive points along the beam. Forces acting upward are assumed positive and downward forces negative.
  • The shear force (V) at any point is equal to the algebraic sum of the external loads and reactions, perpendicular to the beam, to the left of that point.
  • Since the entire beam must be in equilibrium (sum of V = 0), the shear diagram must close to zero at the right end.
  • Consider the loading for increments along the length of the beam in order to determine the shape of the curve.

    if there is no change in the load along the incremental length under consideration, the shear curve is a straight horizontal line (or a curve of zero slope). The slope at any point is defined as the tangent to the curve at that point.

    if a load exists, but does not change in magnitude over successive increments (uniformly distributed), the slope of the shear curve is constant and non-horizontal.

    if a load exists, and increases in magnitude over successive increments, the slope of the shear curve is positive (approaches the vertical); if the magnitude decreases, the slope of the shear curve is negative (approaches the horizontal).
  • Abrupt changes in loading cause abrupt changes in the slope of the shear curve. Concentrated loads produce vertical lines (a jump) in the shear curve.
Shear Diagrams

Given:
the "weightless" beam and loading condition shown.
Determine:
the shear diagram.


Lecture 34


Solution:
Construct the shear diagram by finding the sum Fy at strategic points along the length of the beam from the left end to the right. First, cut a section immediately to the right of the left reaction, which will give a shear equal to th e reaction force of 2200#. The force is posative, so the plot will lie above the x axis. Continue to move along the beam length plotting the change in load; there is no change until the 2400# load, at which the shear drops 2400# from 2200# yielding a shear of -200#.

Again, the shear remains constant until the distributed load. At that point, it drops 400# for each foot, (or 100# for each 1/4 foot of length, etc.), with a total drop of (400#)(6ft) or 2400#. The value of the shear diagram reaches a low of -2600# at t he end of the beam.

As soon as the magnitude of the reaction at the right support is included, the diagram should close so that the shear returns to zero. The right reaction equals 2600# so the diagram does indeed close to zero.

 Diagram Bidang Gaya Lintang

Geser (V) adalah kecenderungan untuk satu bagian dari balok untuk meluncur melewati bagian lain. Besarnya geser di bagian manapun adalah sama dengan jumlah aljabar dari beban dan reaksi bertindak tegak lurus ke bagian itu.


batu langkan melanggar bawah kekuatan geser


TANDA KONVENSI
Jika kecenderungan bagian di sebelah kiri adalah untuk memotong bergerak ke atas, geser positif, jika ia memiliki kecenderungan untuk bergerak turun, itu adalah negatif.


geser menandatangani konvensi


Untuk mempermudah dalam memperoleh tanda yang benar, seseorang dapat mengatakan bahwa itu adalah sama dengan jumlah aljabar dari beban dan reaksi ke kiri dari memotong. Perhatikan bahwa geser internal pada akhir tindakan FBD dalam arah yang berlawanan dari jumlah aljabar dari beban dan reaksi dalam rangka untuk menyeimbangkan kekuatan-kekuatan (SV = 0).

Sebuah diagram geser adalah representasi grafis dari geser pada setiap titik sepanjang anggota.

Untuk plot diagram geser pada balok, geser harus dihitung pada setiap titik sepanjang balok. Salah satu cara adalah dengan hanya plot geser sebagai jumlah aljabar dari beban dan reaksi bertindak tegak lurus balok pada sisi kiri dari kenaikan masing-masing sepanjang balok. Nilai-nilai positif ditunjukkan nilai di atas dan negatif di bawah sumbu referensi.

Cara menggambar DIAGRAM GESER
Mulai dari ujung kiri dan plot nilai-nilai geser eksternal sehubungan dengan hal berikut:
  • Diagram geser adalah representasi grafis dari gaya geser pada titik-titik yang berurutan di sepanjang balok. Gaya yang bekerja atas diasumsikan kekuatan positif dan negatif ke bawah.
  • Gaya geser (V) di setiap titik adalah sama dengan jumlah aljabar dari beban eksternal dan reaksi, tegak lurus balok, ke kiri dari titik itu.
  • Karena seluruh berkas harus dalam keseimbangan (jumlah dari V = 0), diagram geser harus mendekati nol di ujung kanan.
  • Pertimbangkan loading untuk increment sepanjang balok untuk menentukan bentuk kurva.

    jika tidak ada perubahan beban sepanjang tambahan yang dipertimbangkan, geser kurva adalah garis horizontal lurus (atau kurva kemiringan nol). Kemiringan pada setiap titik didefinisikan sebagai bersinggungan dengan kurva pada titik tersebut.

    jika beban itu ada, tetapi tidak perubahan besarnya atas kenaikan berturut-turut (merata), kemiringan kurva geser adalah konstan dan non-horizontal.

    jika beban itu ada, dan peningkatan besarnya atas kenaikan berturut-turut, kemiringan kurva geser adalah positif (mendekati vertikal), jika besarnya menurun, kemiringan kurva geser negatif (mendekati horisontal).
  • Perubahan mendadak dalam pemuatan menyebabkan perubahan mendadak dalam kemiringan kurva geser. Beban terkonsentrasi menghasilkan garis vertikal (melompat) dalam kurva geser.
  • Contoh Soal

    Geser Diagram
    Mengingat:
    yang "ringan" balok dan loading kondisi ditampilkan.
    Tentukan:
    diagram geser.
    Kuliah 34


    Solusi:
    Buatlah diagram geser dengan mencari y jumlah F pada titik-titik strategis sepanjang panjang balok dari ujung kiri ke kanan. Pertama, potong segera bagian di sebelah kanan reaksi kiri, yang akan memberikan geser sama dengan gaya reaksi th 2200 # e. Gaya adalah posative, sehingga plot akan terletak di atas sumbu x. Terus bergerak sepanjang balok merencanakan perubahan beban; tidak ada perubahan sampai 2400 # beban, di mana geser turun 2400 # dari 2200 # menghasilkan geser -200 #.

    Sekali lagi, geser tetap konstan sampai beban didistribusikan. Pada saat itu, tetes 400 # untuk masing-masing kaki, (atau 100 # untuk setiap kaki 1 / 4 panjang, dll), dengan penurunan total (400 #) (6ft) atau 2400 #. Nilai dari diagram geser mencapai rendah -2600 # di akhir t dia dari balok.

    Begitu besarnya reaksi pada dukungan yang tepat yang disertakan, diagram harus menutup sehingga geser kembali ke nol. Reaksi yang tepat sama dengan 2600 # sehingga diagram memang mendekati nol.
  • Sumber : http://darkwing.uoregon.edu/~struct/courseware/461/461_lectures/461_lecture34/461_lecture34.html

    Lecture 35


Apa yang dimaksud Free Body Diagrams?

What are Free Body Diagrams?


One of the most useful aids for solving a statics problem is the free body diagram (FBD). A free body diagram is a graphic, dematerialized, symbolic representation of the body (structure, element or segment of an element) in which all connecting "pieces" have been removed. A FBD is a convenient method to model the structure, structural element, or segment that is under scrutiny. It is a way in which to conceptualize the structure, and its composite elements, so that an analysis may be initialized.

All of the physical attrributes of the structure are removed. This is not completed at random, rather with a distinct method. A body, or segment thereof, is represented by a simple single line. Each connection is solely represented by a juncture with distinct properties, or is replaced by a set of forces and moments which would represent the action at that connection. Internal forces which would be found at a node (connection or joint) can be replaced by representational external forces where that "part" connects would connect with the other member in the FBD. All loads are represented as force systems.


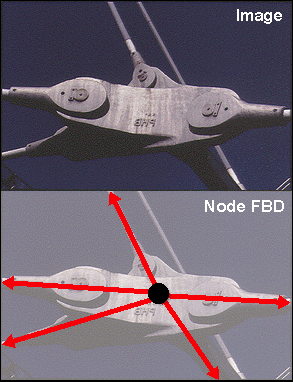
The image to the right is a link to a movie which illustrates the way in which each of the loads on the structure (in this case the bench) are resolved. It also illustrates how each and every physical load that acts upon the structure must be represented. This means that all of the loads are replaced by vectors. Even the supports are replaced by single vectors. Notice how the person, cans and upper shelf dematerialize and are replaced by vectors. The FBD at the end of the movie is not complete. What is missing?
Everything that is needed to solve a force system is included on the FBD. Free body diagrams may not seem necessary in the relatively simple current applications, but as problems become more complex, their usefulness increases.


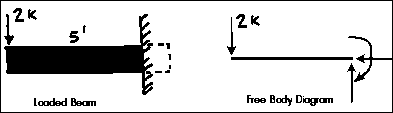
The following is the process for determining the reaction at the wall for a cantilever beam. A FBD is first drawn of the beam. Next, cut the beam free from the wall and replace the wall with the forces that were supporting the beam at the wall before it was cut free. These forces are unknown, but they are the only forces that can keep the beam in equilibrium. They are identical to the internal forces in the beam at that point before it was cut. The internal forces in the beam before it was cut free from its support are also determined when the forces which will keep, or put, the FBD in equilibrium are found.

A fixed support will resist translation in all directions and rotation (moment). The FBD must show all of these directions. The principles of equilibrium can always be used to solve a FBD. In the FBD above Sum Fy = 2K and Sum Fx = 0. The 2K forces (load and vertical reaction force) cause a counter-clockwise couple of 10 K-FT which must be resisted by a moment on the end of the cut section of 10 K-FT acting in a clockwise direction.

three different building configurations acting under the same force system
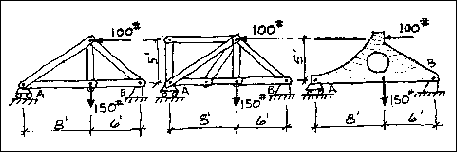
This is an illustration of three different structural systems which have one 100 pound load and one 150 pound load acting on them at exactly the same point. They are also supported with a roller support at the left and pinned support at the right. Each one could be a structure made of any type of material.....wood, steel, bamboo, or perhaps paper.

one free body diagram representing the force system, independent of the geometry of the physical body
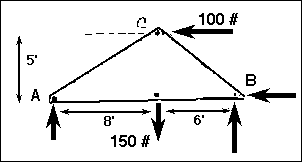
This is a Free Body Diagram of these three systems which has been drawn to represent the force system. Note how all of the internal structure has been removed from this representation. The internal arrangement does not matter for the determination of the supporting reactions! AND, if the supporting and loading geometries are the same, the external reactions will alsways remain the same.

The Umbrian Street Lamp
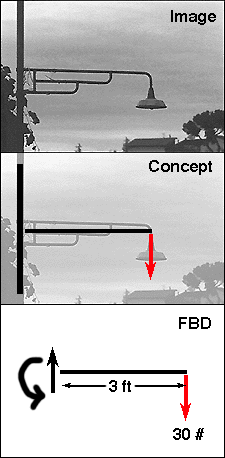
This is a street lamp that is commonly found in Umbria, Italy. It looks like many lamps found all over the world. The three photos illustrate how the free body diagram for this structure should be conceived. The first step is to dematerialize the lamp. Identify the center of the body and draw this as a straght line. The only identifieable weight is the lamp, so this is drawn as a vector as indicated. The next step is to determine what is required at the other end of the lamp to maintain equilibrium; what is needed to keep the lamp from spinning off into space? These forces (including the moment) are drawn as indicated. What is missing from this illustration? The magnitudes of the moment and force at the left side should be included in a complete free body diagram.
The Verona Column
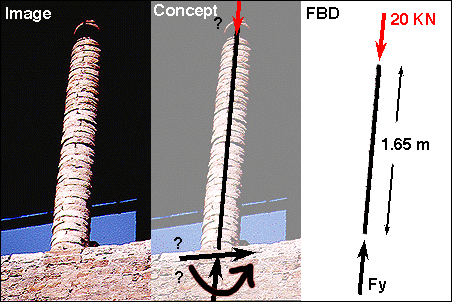
There are many situations in which the exact conditions of the end restraints are not able to be determined in the first glance. The materiality and relative stiffness of the elements which are being supported/connected provide clues as to the actual behavior.

This is a thin brick column supporting a wooden canopy at the old castle in Verona, Italy. How is this element connected to the wall below?

Most likely one would model this behavior as a simple connection. The masonry would have a very difficult time transferring moments since it cannot develop the required tensile half of the couple. The mortar would also most likely yield if a lateral load of significant force were to be applied. However, one could argue that the column can, and certainly does, resist a small amount of lateral load. And, due to the force of gravity pulling each brick down there could be the possibility for the base to begin to resist a moderate moment as long as the tensile force does not exceed the compressive force due to the self-weight of the structure. So, where does this leave the FBD? In the hands of the designer to make a choice on the type of model that he/she desires.... What is the correct model? It depends.

Apa yang dimaksud 'Free body diagram' ?


Salah satu alat bantu yang paling berguna untuk memecahkan masalah statika adalah diagram benda bebas (FBD). Diagram benda bebas adalah, grafis dematerialized, representasi simbolis dari tubuh (struktur, elemen atau segmen elemen) di mana semua menghubungkan "potongan" telah dihapus. FBD adalah metode yang nyaman untuk model struktur, elemen struktur, atau segmen yang berada di bawah pengawasan. Ini adalah cara di mana untuk konsep struktur, dan elemen komposit, sehingga analisis dapat diinisialisasi.

Semua attrributes fisik dari struktur dihapus. Hal ini tidak diselesaikan secara acak, bukan dengan metode yang berbeda. Sebuah badan, atau segmen daripadanya, diwakili oleh garis tunggal yang sederhana. Setiap koneksi hanya diwakili oleh titik dengan sifat yang berbeda, atau digantikan oleh seperangkat kekuatan dan momen yang akan mewakili aksi di koneksi. Kekuatan internal yang akan ditemukan pada simpul (koneksi atau sendi) dapat digantikan oleh kekuatan eksternal representasional mana yang "bagian" menghubungkan akan menghubungkan dengan anggota lain dalam FBD tersebut. Semua beban yang direpresentasikan sebagai sistem gaya.


Gambar ke kanan adalah link ke sebuah film yang menggambarkan cara di mana masing-masing beban pada struktur (dalam hal ini bangku) diselesaikan. Hal ini juga menggambarkan bagaimana masing-masing dan setiap beban fisik yang bertindak pada struktur harus diwakili. Ini berarti bahwa semua beban yang digantikan oleh vektor. Bahkan mendukung digantikan oleh vektor tunggal.
Perhatikan bagaimana orang, kaleng dan rak atas dematerialize dan digantikan oleh vektor. Para FBD di akhir film tidak lengkap. Apa yang hilang?
Segala sesuatu yang diperlukan untuk memecahkan suatu sistem gaya disertakan pada FBD tersebut. Diagram benda bebas mungkin tidak diperlukan dalam aplikasi saat ini relatif sederhana, tetapi sebagai masalah menjadi lebih kompleks, meningkatkan kegunaan mereka.


Berikut ini adalah proses untuk menentukan reaksi pada dinding untuk balok kantilever. FBD adalah pertama ditarik dari balok. Selanjutnya, potong balok bebas dari dinding dan mengganti dinding dengan kekuatan-kekuatan yang mendukung balok pada dinding sebelum dipotong gratis. Kekuatan ini tidak diketahui, tetapi mereka satu-satunya pasukan yang dapat menjaga balok dalam kesetimbangan. Mereka identik dengan kekuatan-kekuatan internal dalam berkas pada titik bahwa sebelum itu dipotong. Kekuatan-kekuatan internal dalam berkas sebelum dipotong bebas dari dukungan juga ditentukan ketika pasukan yang akan tetap, atau meletakkan, FBD dalam kesetimbangan ditemukan.

Sebuah dukungan tetap akan menolak terjemahan dalam segala arah dan rotasi (momen). FBD harus menunjukkan semua arah. Prinsip-prinsip keseimbangan selalu dapat digunakan untuk memecahkan suatu FBD. Dalam FBD atas Sum F y = 2K dan Sum F x = 0. Pasukan 2K (beban dan gaya reaksi vertikal) menyebabkan pasangan berlawanan arah jarum jam dari 10 K-FT yang harus dilawan oleh sejenak di akhir bagian yang dipotong dari 10 K-FT bertindak searah jarum jam.

tiga konfigurasi bangunan yang berbeda bertindak di bawah sistem gaya yang sama
Ini adalah sebuah ilustrasi dari tiga sistem struktur yang berbeda yang memiliki satu beban 100 kilo dan satu kilo 150 beban yang bekerja pada mereka tepat pada titik yang sama. Mereka juga didukung dengan dukungan rol pada dukungan kiri dan ditempelkan di sebelah kanan. Masing-masing bisa menjadi struktur dibuat dari setiap jenis material ..... kayu, baja, bambu, atau mungkin kertas.

satu diagram benda bebas yang mewakili sistem gaya, independen dari geometri tubuh fisik
Ini adalah diagram benda bebas dari ketiga sistem yang telah ditarik untuk mewakili sistem gaya. Perhatikan bagaimana semua struktur internal telah dihapus dari representasi ini. Pengaturan internal tidak peduli untuk penentuan reaksi mendukung! DAN, jika geometri mendukung dan loading sama, reaksi eksternal alsways akan tetap sama.
Para Umbrian Lampu Jalan
Ini adalah lampu jalanan yang umum ditemukan di Umbria, Italia. Ini terlihat seperti lampu banyak ditemukan di seluruh dunia. Tiga foto menggambarkan bagaimana diagram benda bebas untuk struktur ini harus dipahami. Langkah pertama adalah untuk dematerialize lampu. Mengidentifikasi pusat tubuh dan imbang ini sebagai garis straght. Berat hanya identifieable adalah lampu, jadi ini digambar sebagai vektor seperti yang ditunjukkan. Langkah berikutnya adalah untuk menentukan apa yang diperlukan pada ujung lampu untuk mempertahankan ekuilibrium; apa yang dibutuhkan untuk menjaga lampu dari berputar ke angkasa? Kekuatan ini (termasuk saat ini) diambil seperti ditunjukkan. Apa yang hilang dari ilustrasi ini? Besaran momen dan kekuatan di sisi kiri harus dimasukkan dalam diagram tubuh lengkap gratis.
Verona Kolom
Ada banyak situasi di mana kondisi yang tepat dari pengekangan akhir tidak dapat ditentukan pada pandangan pertama. Materialitas dan kekakuan relatif dari unsur-unsur yang didukung / terhubung memberikan petunjuk pada perilaku aktual.

Ini adalah kolom batu bata tipis mendukung kanopi kayu di kastil tua di Verona, Italia. Bagaimana elemen ini terhubung ke dinding di bawah?

Salah satu kemungkinan besar akan model perilaku ini sebagai koneksi sederhana. Batu akan memiliki waktu yang sangat sulit mentransfer saat karena tidak dapat mengembangkan setengah tarik yang dibutuhkan pasangan. Mortir tersebut juga akan menghasilkan kemungkinan besar jika beban lateral kekuatan yang signifikan itu harus diterapkan. Namun, orang dapat berargumentasi bahwa kolom dapat, dan tentu saja, menolak sejumlah kecil beban lateral. Dan, karena gaya gravitasi menarik setiap batu bata di sana bisa menjadi kemungkinan dasar untuk mulai menolak saat moderat selama gaya tarik tidak melebihi gaya tekan karena berat diri-struktur. Jadi, mana ini meninggalkan FBD itu? Di tangan desainer untuk membuat pilihan pada jenis model yang ia / dia inginkan .... Apa model yang benar? Itu tergantung.

Sumber : http://web.mit.edu/4.441/1_lectures/1_lecture14/1_lecture14.html